Using verifiers to get SQC information – SCANALYST 3
Category : Uncategorized
So then, how do barcode producers make sure they are not violating the standards? There are 2 ways:
- 100% inspection – usually only necessary when the printing process is not performing within acceptable ‘control’
- Use Statistical Process Control Methods (SPC or SQC) to establish that the printing process is within tight control and then, periodic sampling and related production procedures
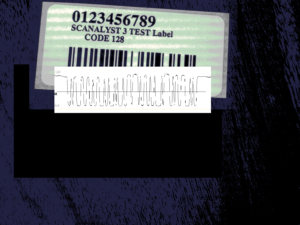
To determine which is best for you, the first step is to determine if your printer is capable of maintaining a tight control of the barcode quality parameters. To do that you can verify a set of sample barcodes using an ISO verifier. These will show detail on the measurements for the quality parameters. Record the details for each parameter[ii] including the % shown as well at the numerical grade.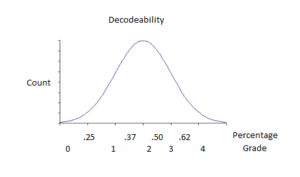
Plot the percentages for each parameter in a
chart. The shape of the chart will typically show a bell shaped curve from which you will be able to see how
well a particular quality parameter is maintained.
Some printing processes have difficulty, but fortunately, one of the most widely used types is quite capable. Thermal transfer printers can produce grade 4 (the best) very consistently if used correctly. Start with a good label design (where the barcode is Grade 4), use labels and ribbons that have been tested for use on your printer and finally, verify print quality before and after each run/lot/shift/day to ensure you are still in compliance. The same is true for printers that have been serviced or if you are changing suppliers of labels or ribbons. These periodic inspections should be part of your published production procedures and a detailed record should be kept. The initial printer capability study, the periodic inspections and the published production procedures form your GMP for barcode printing.
If you have any questions, please give us a call or send an email.
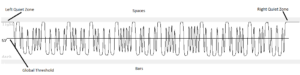
[i] A scan profile is a record of the reflectance values measured along a line across the width of a barcode.
[ii] If you are using SCANALYST you will find all of the parameter detail in the database